Economic Performance
vs Green Energy Preference
Welcome to our website! Check our visuals for get an understanding of relationship of countries well-being and their green energy preference.
See Visualizations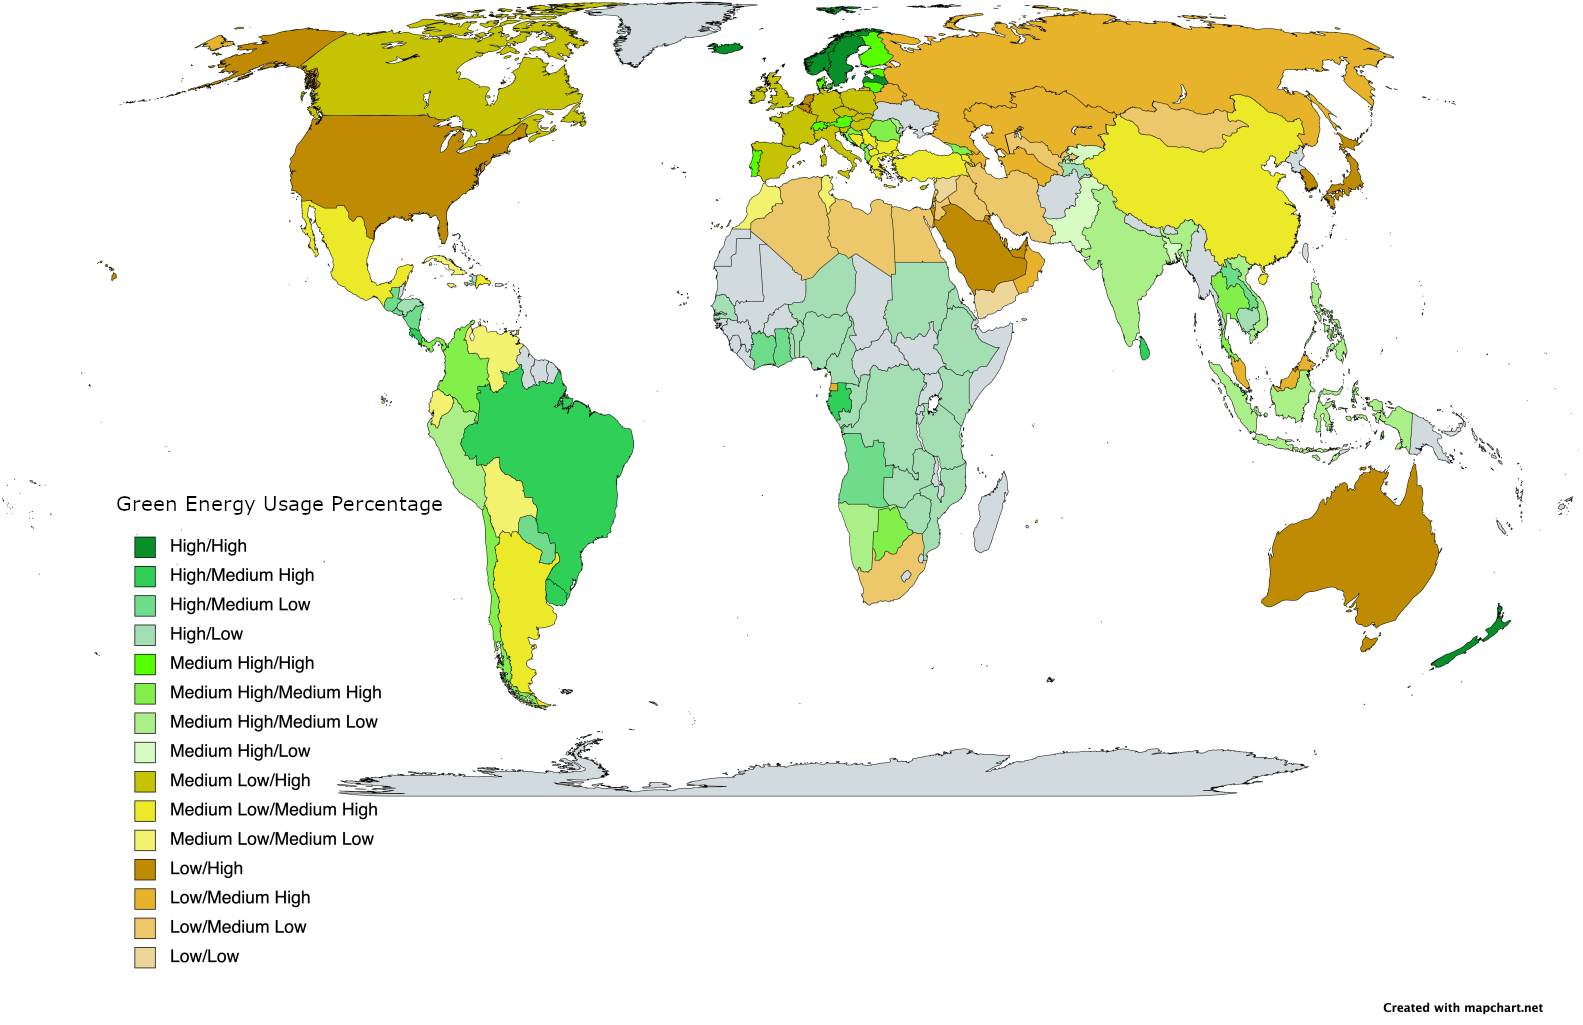
Overview
An overview of countries on a graph plotting GDP per Capita vs. renewable energy usage percentage
Demo
A visual to represent green energy usage of countries, click on leaves to get some comprehensive country specific information
Code
Check our GitHub repo for the code for the website and the graphs!